Debug a UnifiedViews Pipeline
Debug a UnifiedViews Pipeline
This section contains a short guide on how to debug a UnifiedViews pipeline.
Debugging of the pipeline means that the pipeline is executed, but you can see the data which flows through the pipeline, you can view that in the browser.
Two ways exist to debug a pipeline.
Click PIPELINES.
To run the pipeline in debug mode, click the Debug icon in the corresponding row in the pipelines table.
Note
Debugging of the pipeline as well as running is available only, if the backend is online.
After starting the pipeline execution in debug mode, the system redirects you to the Execution Monitor section where details of the pipeline execution will be shown:
Read more information how to work with the Execution Monitor section Execution Monitor Section.
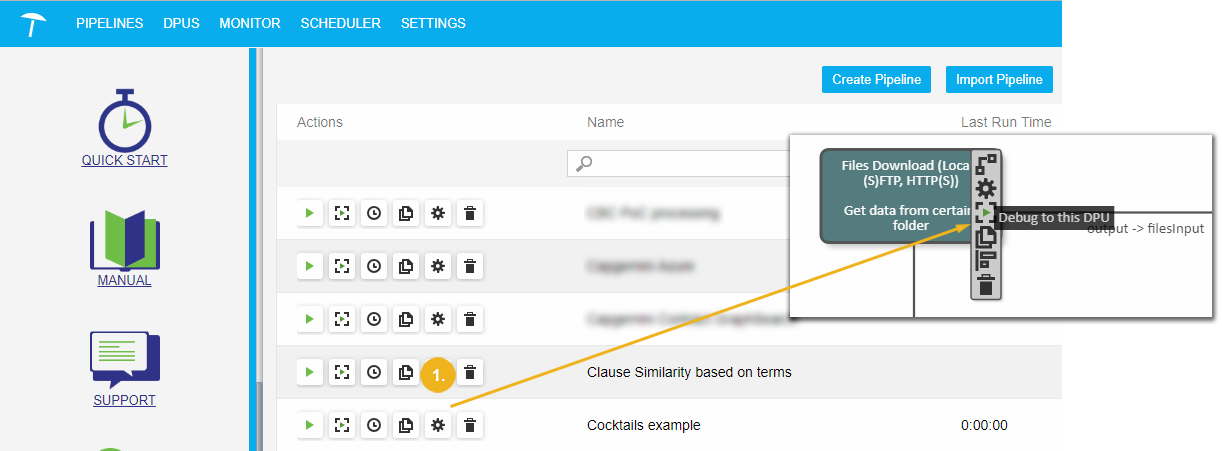
It is also possible to debug the pipeline from the pipeline canvas.
Click Edit in the pipelines table, then click Debug to this DPU icon on the DPU instance tool bar.
 |
After that the Debug Window with the debug information will appear.
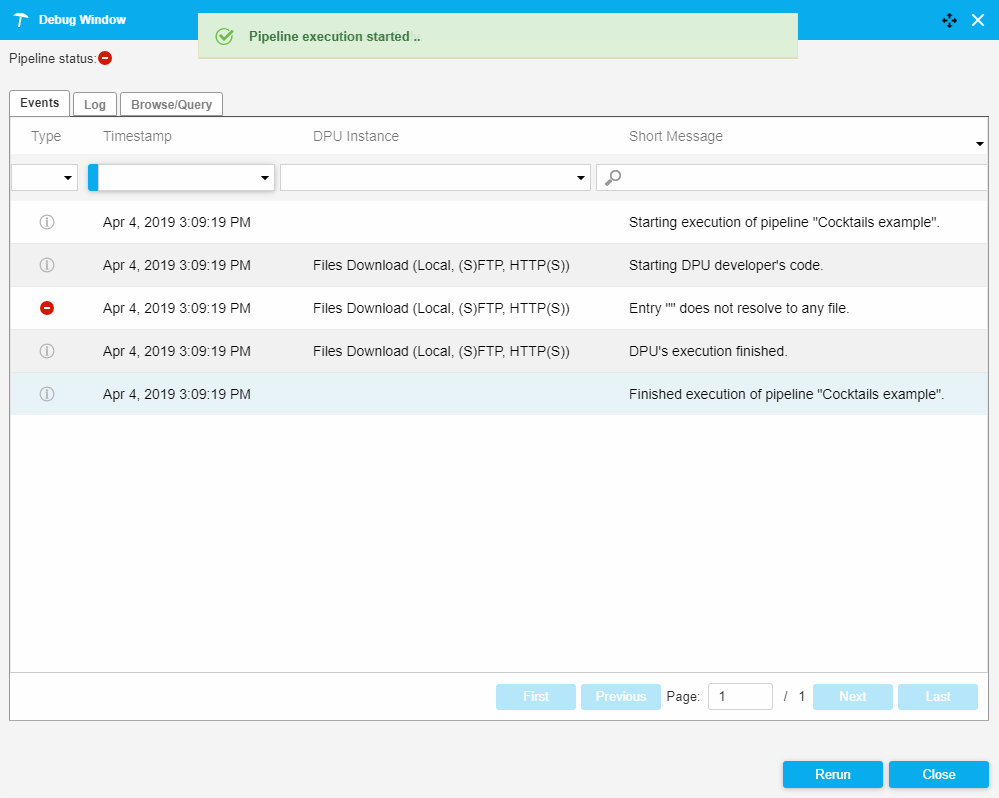 |
For detailed information about the Debug Window see Execution Monitor Section .