The GraphSearch Admin Dashboard Menu Elements
The GraphSearch Admin Dashboard Menu Elements
In this section you find a short guide on the menu elements the GraphSearch Admin Dashboard provides.
You can access the GraphSearchAdmin Dashboardafter you have logged in to theGraphSearch instanceof your PoolParty installation.
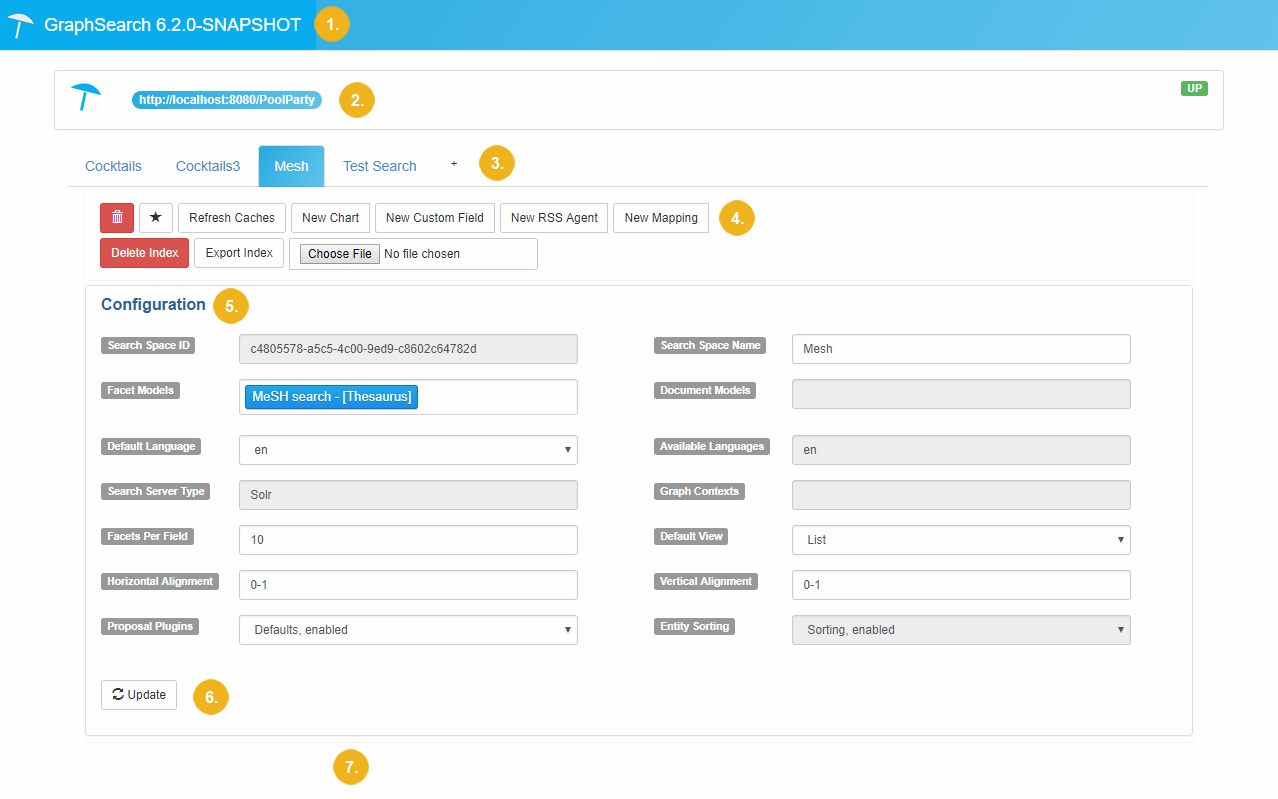
The image below also contains an example of a Search Space configuration based on a Solr search index. Details on the options find below.
 |
Available Options
Element | No. in the Image | Description |
|---|---|---|
GraphSearch Admin Dashboard Title Bar | 1 | Displays the GraphSearch version. Click it to open the GraphSearch interface. |
Server Information | 2 | This area displays the PoolParty server instance you are connected to. Additionally you find connection information in the right-hand corner.
|
Search Spaces tabs | 3 |
|
Configuration buttons | 4 | The buttons in this area can be used to add elements to a Search Space. Available buttons depend on the search index used, which means the previously configured Search Server Type . Details on the available options find in these topics: Create a Search Space and Configure an Existing Search Space |
Configuration Section | 5 | The area displayed for each Search Space containing the configuration options and information.
|
Update button | 6 | After you have changed options or added functions, use this button to save your changes. |
Mappings - Charts: Setup Area | 7 | If you add mappings to your Search Space or charts, their configuration information will be displayed here. Details find in these topics: Configure a Pie or Column Chart and Check and Create Mappings for a Search Space |