PoolParty's Visual Mapper lets you browse through your project in a different way.
Visual browsing helps thesaurus managers to get an overview over existing structures and to present concepts and their relations in an appealing way. It has an advantage over the regular tree view, where a concept's relation to only one broader concept can be depicted at one time and no other connections to related concepts can be seen.
In the Visual Mapper you can see all relations of a concept. You can even get an idea of the size of the tree below the related concepts by the size of the bubble and also what types of relations will be available for the related concept.
The legend in the upper right-hand corner of the visualization lists the relations that are displayed in the visualization and the respective color code.
Click on the Visualization tab of any concept and see all its relations at once.
Navigate through your thesaurus by clicking on a related concept.
Jump to the Details View of a concept by clicking the currently selected concept in the middle of the visualization.
Click the arrow down button below the visualisation to use the Export as PNG function to download its actual state as .png.
The default Save As dialogue of your browser opens.
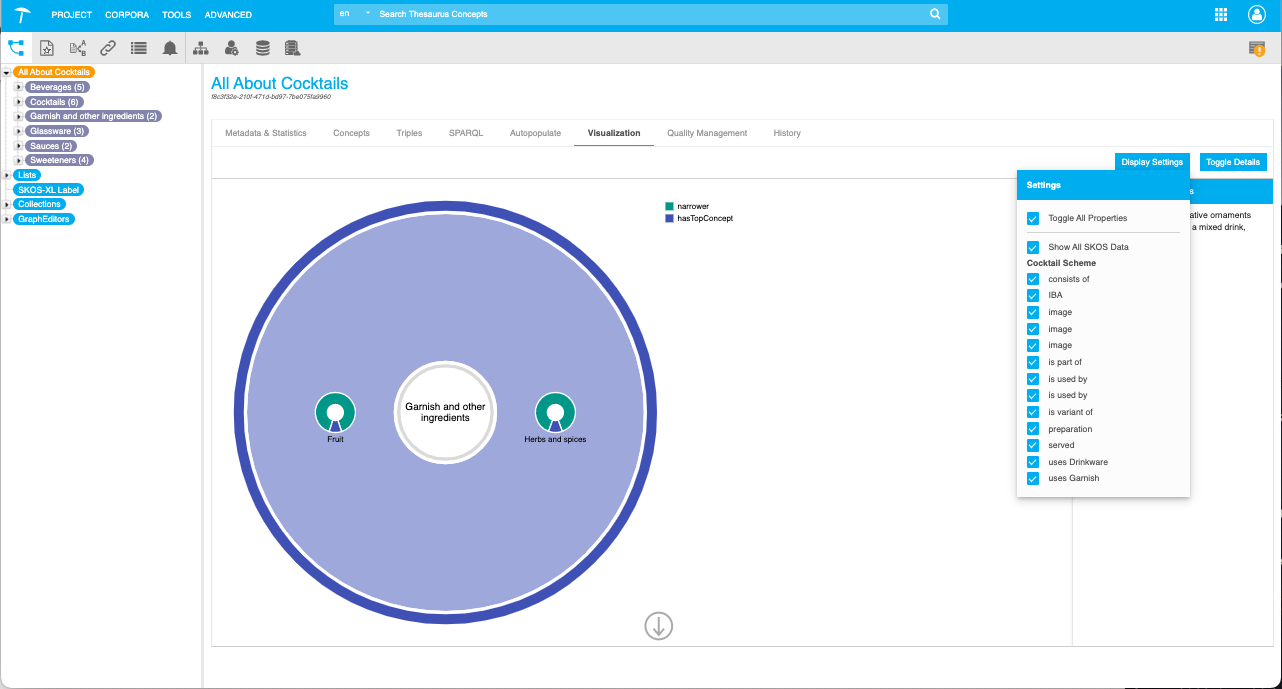
Use the Display Settings button to configure these options:
Toggle All Properties: all available properties and values will be active or inactive if you check this box.
Show All SKOS Data: relations and data (concepts, concept schemes, labels) based on SKOS definitions will be displayed.
Custom Scheme Name, e.g. Cocktail Scheme: the data related or based on the respective custom scheme (concept relations, attributes and classes) will be displayed.
Use the Toggle Details button to display the details pane for the selected concept.
In the image below the visualization settings have been set to:
Toggle Details is active.
A custom scheme (in this case the Cocktail Scheme) is active, therefore the color legend displays the relations of the project's active custom scheme.
Toggle All Properties: all available properties and values will be active or inactive if you check this box.
 |