Configure a Pie or Column Chart
Configure a Pie or Column Chart
This section contains a short guide on how to create a pie or column chart. GraphSearch makes simple as well as column 2D charts available.
In order to be able to set up a pie or column chart data visualisation in GraphSearch, you have to set up a Search Space first. The configuration buttons become available inside each Search Space's tab then.
Steps to Set Up a Column or Pie Chart in PoolParty's GraphSearch
In the opened GraphSearch Admin Dashboard , find your Search Space and activate its tab.
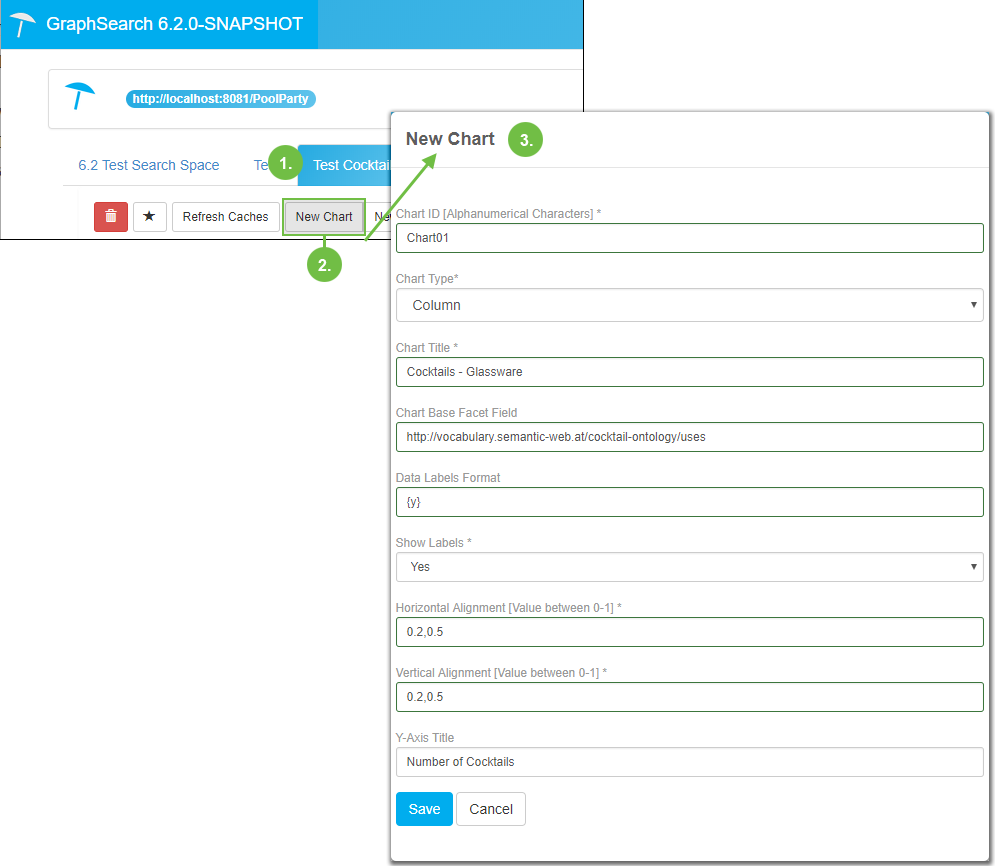
In the Configuration area click New Chart. The New Chart dialogue will open.
Define the settings as described in more detail below, click Save to confirm.
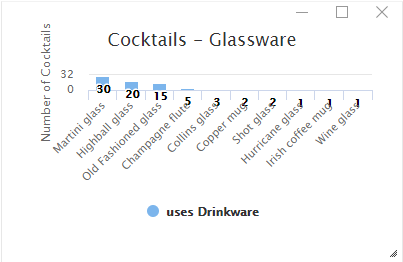
The example settings used here will result in a small column chart, as shown below.
 |
 |
Settings marked with an asterisk are mandatory.
Value | Description | Details - Examples |
|---|---|---|
Chart ID [Alphanumerical Characters]* | Any combination of letters and numbers you want to use as unique ID for this chart. | Examples: pie1, column2 |
Chart Type | Select from the drop down: Column or Pie | |
Chart Title* | The descriptive caption that will appear at the bottom of the chart. | |
Chart Base Facet Field | The facet fields are data called from the custom scheme you defined for the search space. Look up the relation of the custom scheme you want to use and enter its URI here. | |
Data Labels Format | Format of the data label based on Highcharts specifications. See Highcharts Framework Labels Format definition for more information. | {y} mm (adds 'mm' to the data value) {point.name} displays the name of a data point in a pie chart. |
Show Labels * | You can choose from the drop down between 'Yes' and 'No', to determine if the chart will have label descriptions for the X- and Y-axis. | |
Horizontal Alignment [Value between 0-1] * | Location of the chart placed in the GraphSearch interface search result pane. Each value must be in the form of 'x.x' and 'y.y' respectively, representing the location of the chart relative to the pane. The upper left-hand corner of the pane represents 0, the upper right-hand corner represents 1 for horizontal alignment, the same is true for vertical. Use values between 0 and 1 to define the alignment of the chart, and for horizontal as well as vertical alignment, use two comma separated definitions. NoteThese values also determine the shape of the chart. You can move the chart inside the pane using your mouse after you created it. | Horizontal: 0.2,0.5 Vertical: 0.3,0.6 |
Vertical Alignment [Value between 0-1] * | ||
Y-Axis Title (Column chart only) | For column charts this field becomes avaiable, when you select the type from the drop down. You can enter a caption of your choice for the Y-axis of a chart here. |