Execution Monitor Overview
Execution Monitor Overview
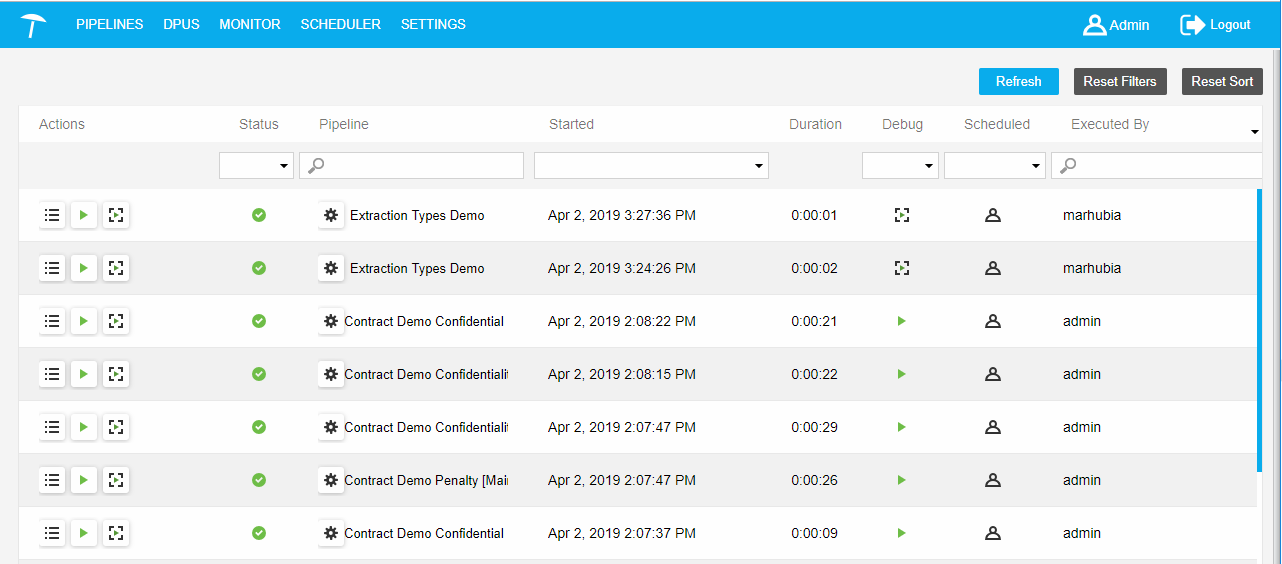
This section contains a short guide on the Execution Monitor and it options and settings.
The Execution Monitor section is represented as a table that contains the following columns.
Note
You can sort by the columns Status, Pipeline, Started, Debug, Scheduled, or Executed by.
Column | Icon | Option | Description | |
|---|---|---|---|---|
Actions | Debug data | NoteThis icon has two functions, depending on how the pipeline is executed. is displayed for executions that have been started in debug mode. | ||
Show log | is displayed for executions that have been started in common mode. | |||
| Cancel | is displayed only for executions which are in RUNNING and SCHEDULED states. | ||
Run pipeline | is displayed for executions which are in all states except RUNNING and CANCELLING. | |||
Debug pipeline | is displayed for executions which are in all states except RUNNING and CANCELLING. | |||
Status | actual status of the executions, depicted by these icons | |||
| SCHEDULED | |||
| RUNNING | |||
| CANCELLING | |||
| CANCELLED | |||
| FAILED | |||
| FINISHED SUCCESS | |||
| FINISHED WARNING | |||
Pipeline |
| Details icon | name of the executed pipeline - click the icon to display the details of this pipeline | |
Started | - | Date and time of the last run of this pipeline | ||
Duration | - | Time that the execution has taken. | ||
Debug |
| shows if a pipeline has been run on debug mode or in run mode | ||
Scheduled |
| shows if a pipeline has been scheduled or not | ||
Executed by | user name of the user that executed the pipeline | |||


Above the table, there are these buttons:
Refresh: for refreshing the table.
Reset Filers: for clearing filters of the table.
Reset Sort: to reset custom sorting.
 |
Execution records are created and placed into the table after the following actions:
Run a pipeline from the Pipelines section.
Debug a pipeline from the Pipelines section.
Clicking Debug to this DPU icon on the DPU instance tool bar in pipeline canvas.
The start which is planned by a scheduling rule.