Execution Monitor - Options in Execution Records
Execution Monitor - Options in Execution Records
This section contains a short guide on options that are available inside the Execution Monitor.
You are authorized to interrupt the pipeline execution if this button is visible. Click to cancel the execution.
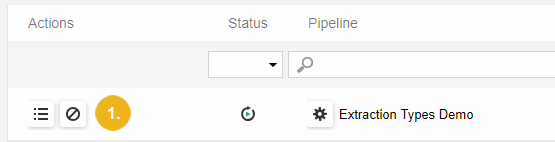
Note
The Cancel button is available in an execution table only if the pipeline execution is in states RUNNING or SCHEDULED.
The user is able to repeat the pipeline running directly from Execution Monitor section. Click Run, or Debug for running in debug mode .
Note
New executions will be shown in the table.
Click Debug Data (3), to follow the events, logs and (when debugging) data flow between DPUs.
The Viewer for Execution Details (VED) appears as a slide window on the right side (4). VED lists all records of the pipeline execution.
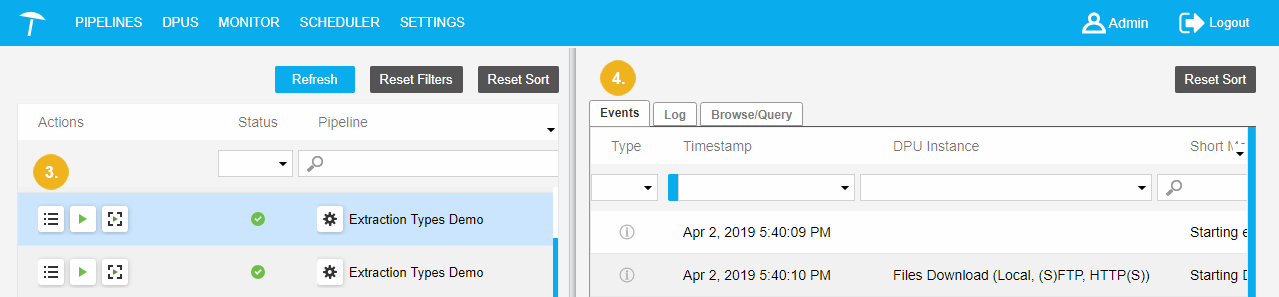 |
The user may follow the data flow between DPUs. VED consists of three tabs: