Visualization in GraphSearch
Visualization in GraphSearch
In addition to presenting search result in list view, GraphSearch provides a visualization feature.
You can use it to display statistics of facet information in charts for more straightforward understanding of the dataset and easier analytics.
Currently GraphSearch supports three chart templates, namely:
Pie Chart,
Column Chart and
2D Column Chart (stacked column chart).
The following properties are available to configure all charts:
Field Name | Description | Example | Mandatory |
|---|---|---|---|
Chart ID | A unique identifier representing a chart in GraphSearch which can be chosen freely. | pie1, column2 |  |
Base Facet Field | The facet field used to facet data and render a chart according to the facet members. When GraphSearch is on top of a search index driven by Solr or Elasticsearch, the facet field is a dynamic field created by the index server represented by an identifier. In the case of GraphSearch on an RDF dataset, the facet field is represented by the predicate URI. Facet field identifier or predicate URI can be found at the Search Fields tab of the admin UI. | Solr/Elasticsearch: dyn_uri_Topic RDF: http://schema.org/memberOf | |
Chart Title | Title of the chart displayed at top of the chart. | My Pie Chart | |
Data Labels Format | Format of the data label based on Highcharts specifications. See http://api.highcharts.com/highcharts/plotOptions.series.dataLabels.format for more information. | {y} mm (adds 'mm' to the data value) {point.name} displays the name of data point in a pie chart | |
Show Labels | Toggle display of labels. | true | |
Horizontal / Vertical Placement | Location of the chart placed in the start window. Each value must be in the form of "x.x,y.y" representing the location of the chart relative to the window and must be a range between 0 and 1. | Horizontal: 0.1,0.4 Vertical: 0.3,0.5 |
More configuration options will be explained per chart type.
How to Create a Chart
To create a chart, navigate to the Charts tab in the admin UI, and simply click any chart creation button.
See the screenshot below:
 |
Chart Types
Pie Chart
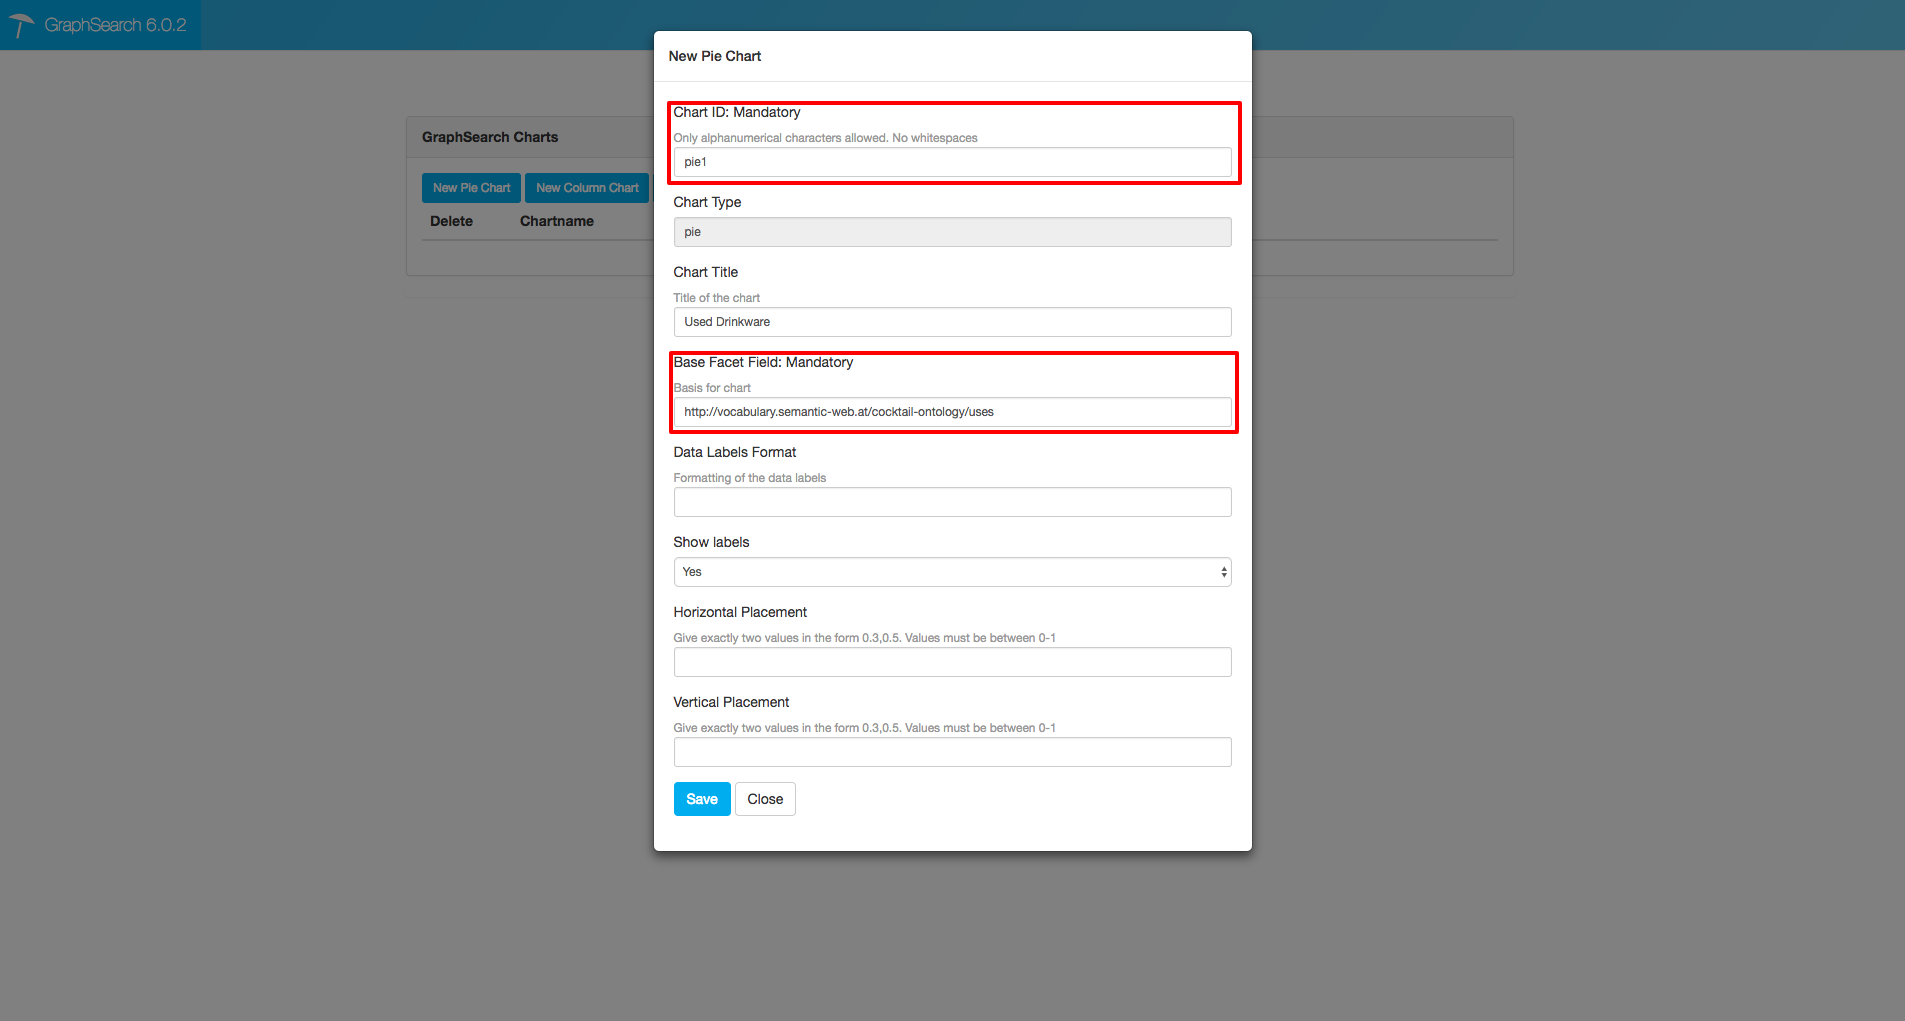
Click the button New Pie Chart in the Chart tab to create a new pie chart.
Then fill in the required properties in the pop-up configuration dialog.
As mentioned previously, you have to specify a random chart id and facet to visualize by providing the facet identifier (for Solr / Elasticsearch backend) or facet predicate URI (for RDF database backend).
See the screenshot below as an example.
 |
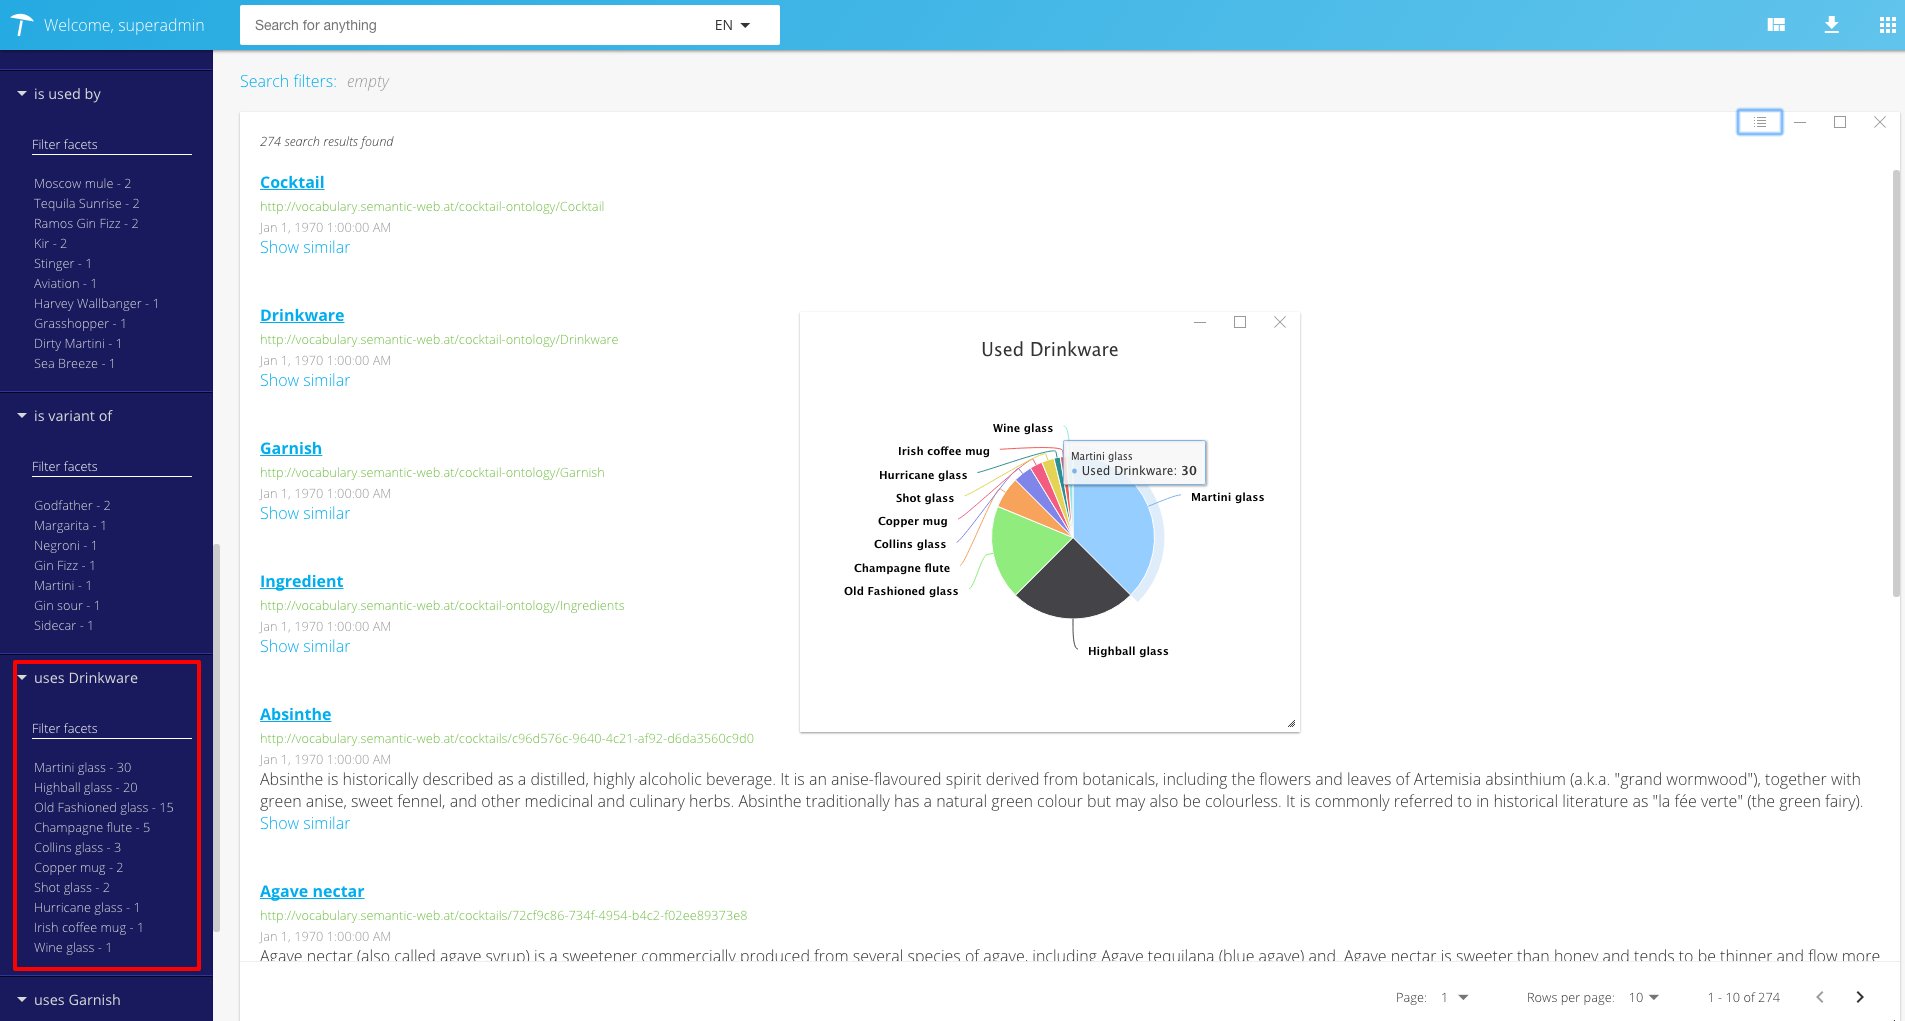
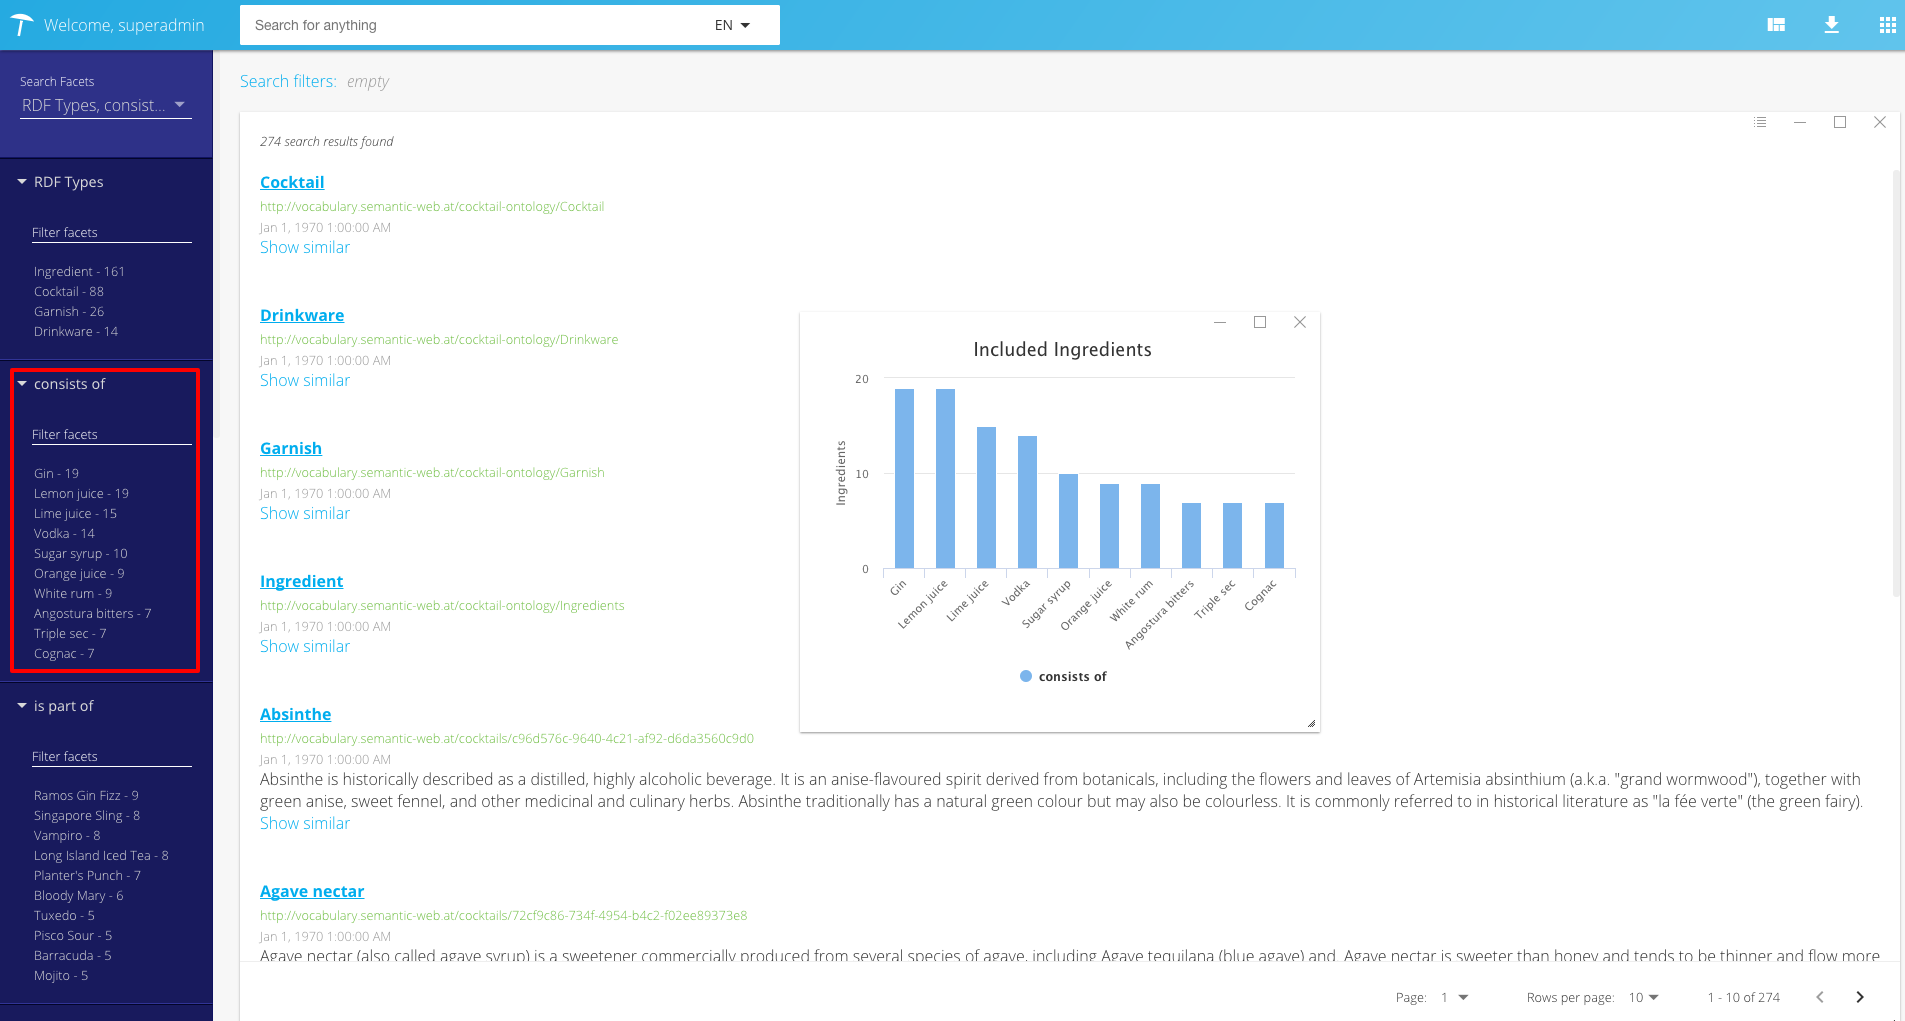
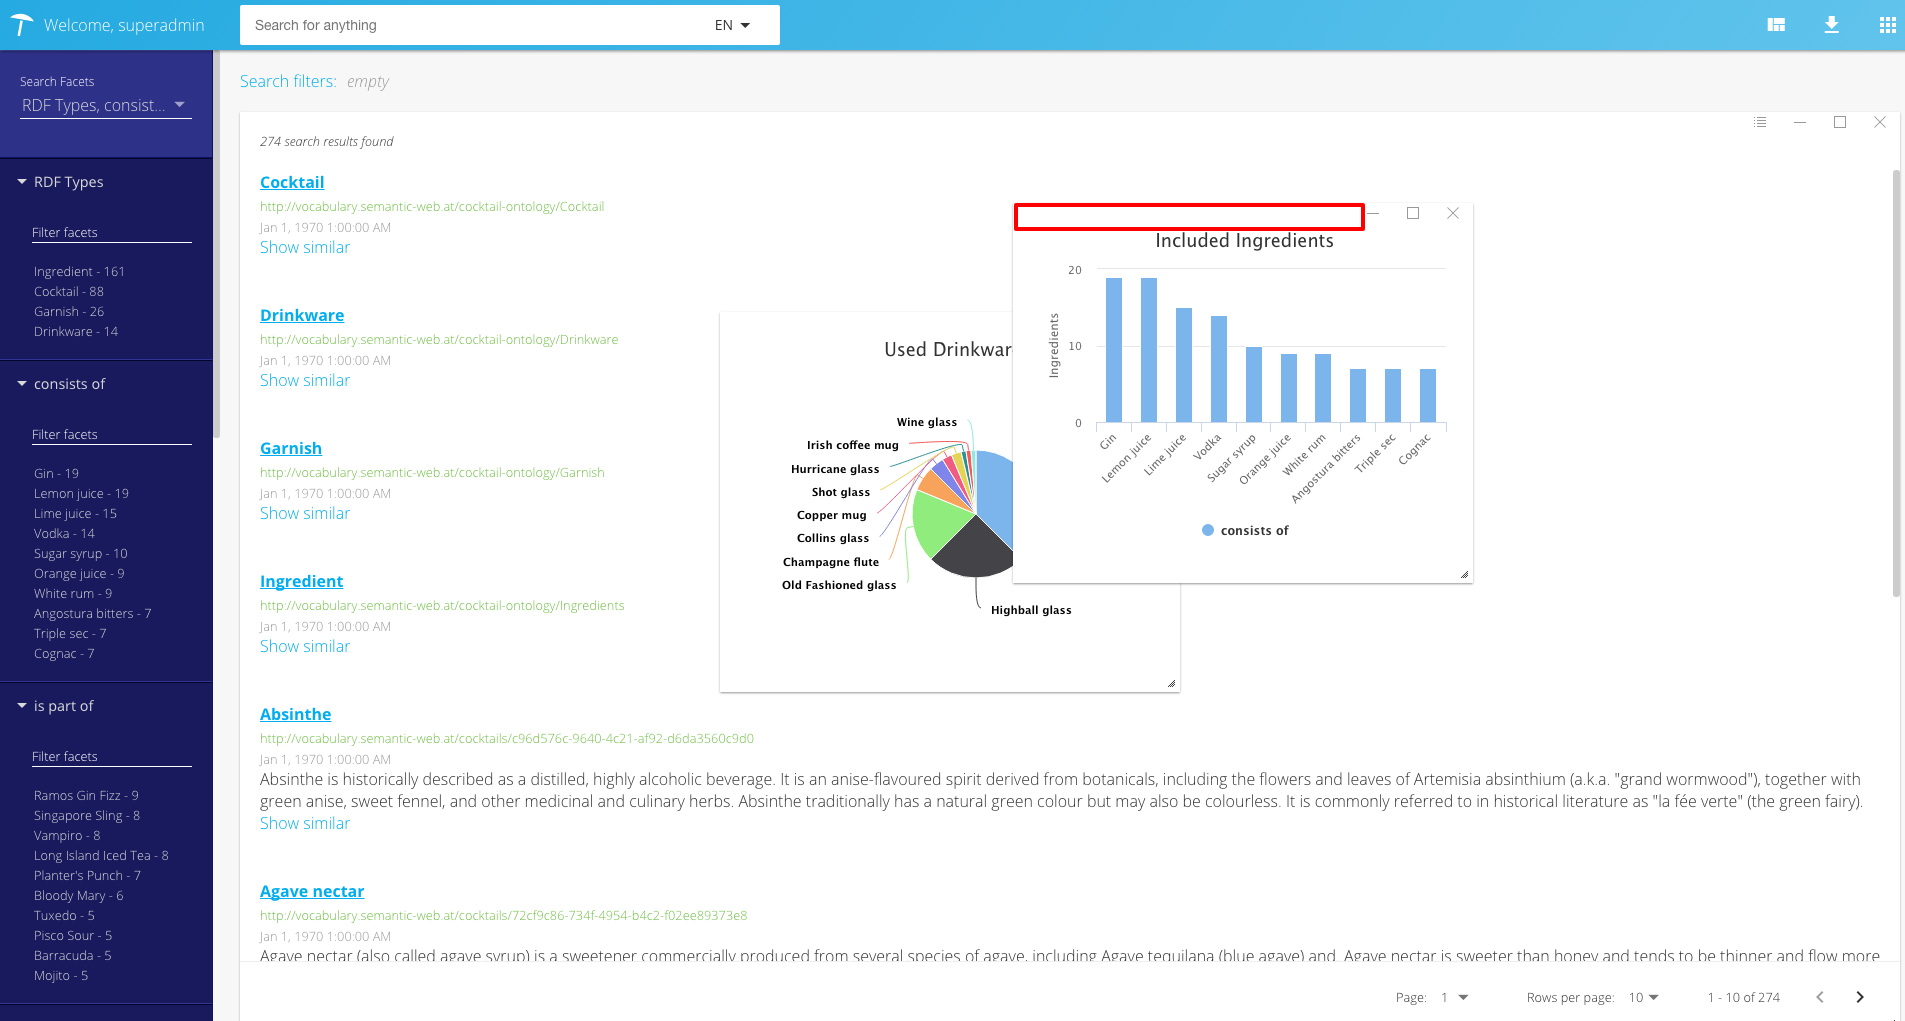
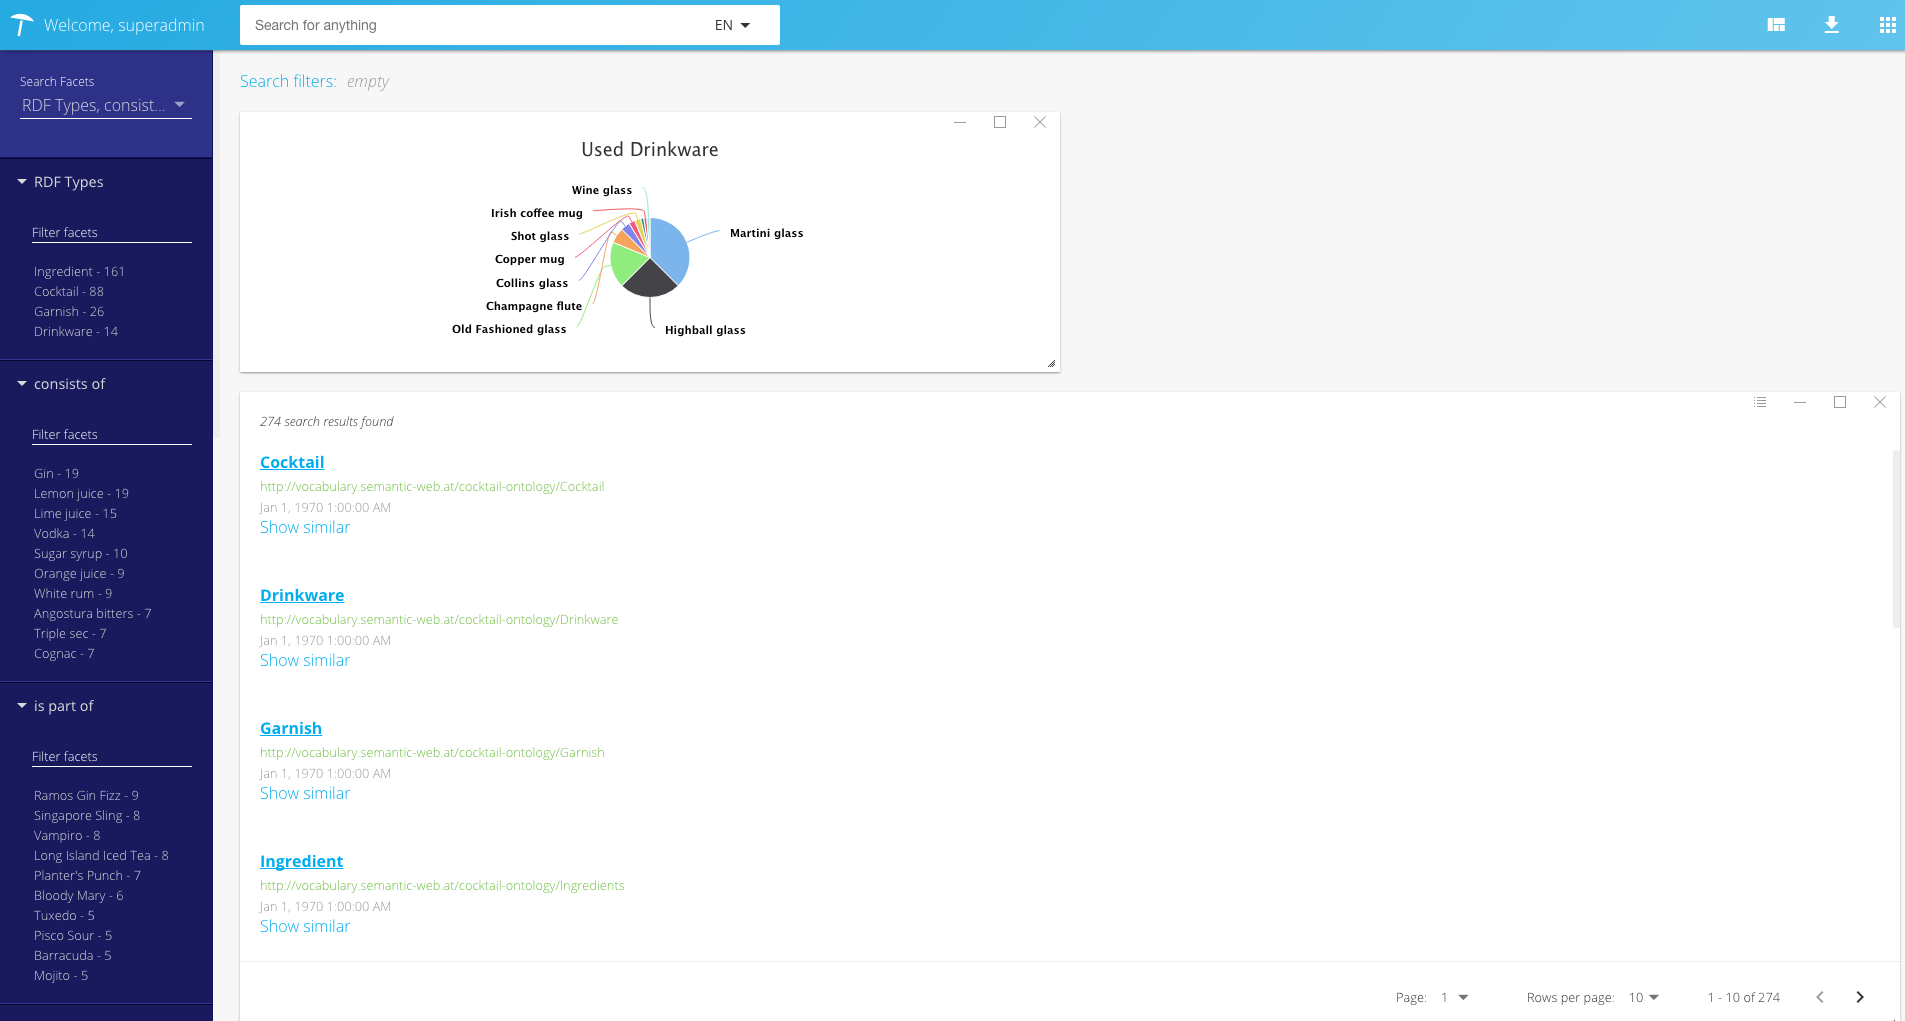
After saving the configuration, the chart is created and can be seen when navigating to the start page of GraphSearch.
The data behind the chart corresponds to the selected facet:
 |
Column Chart
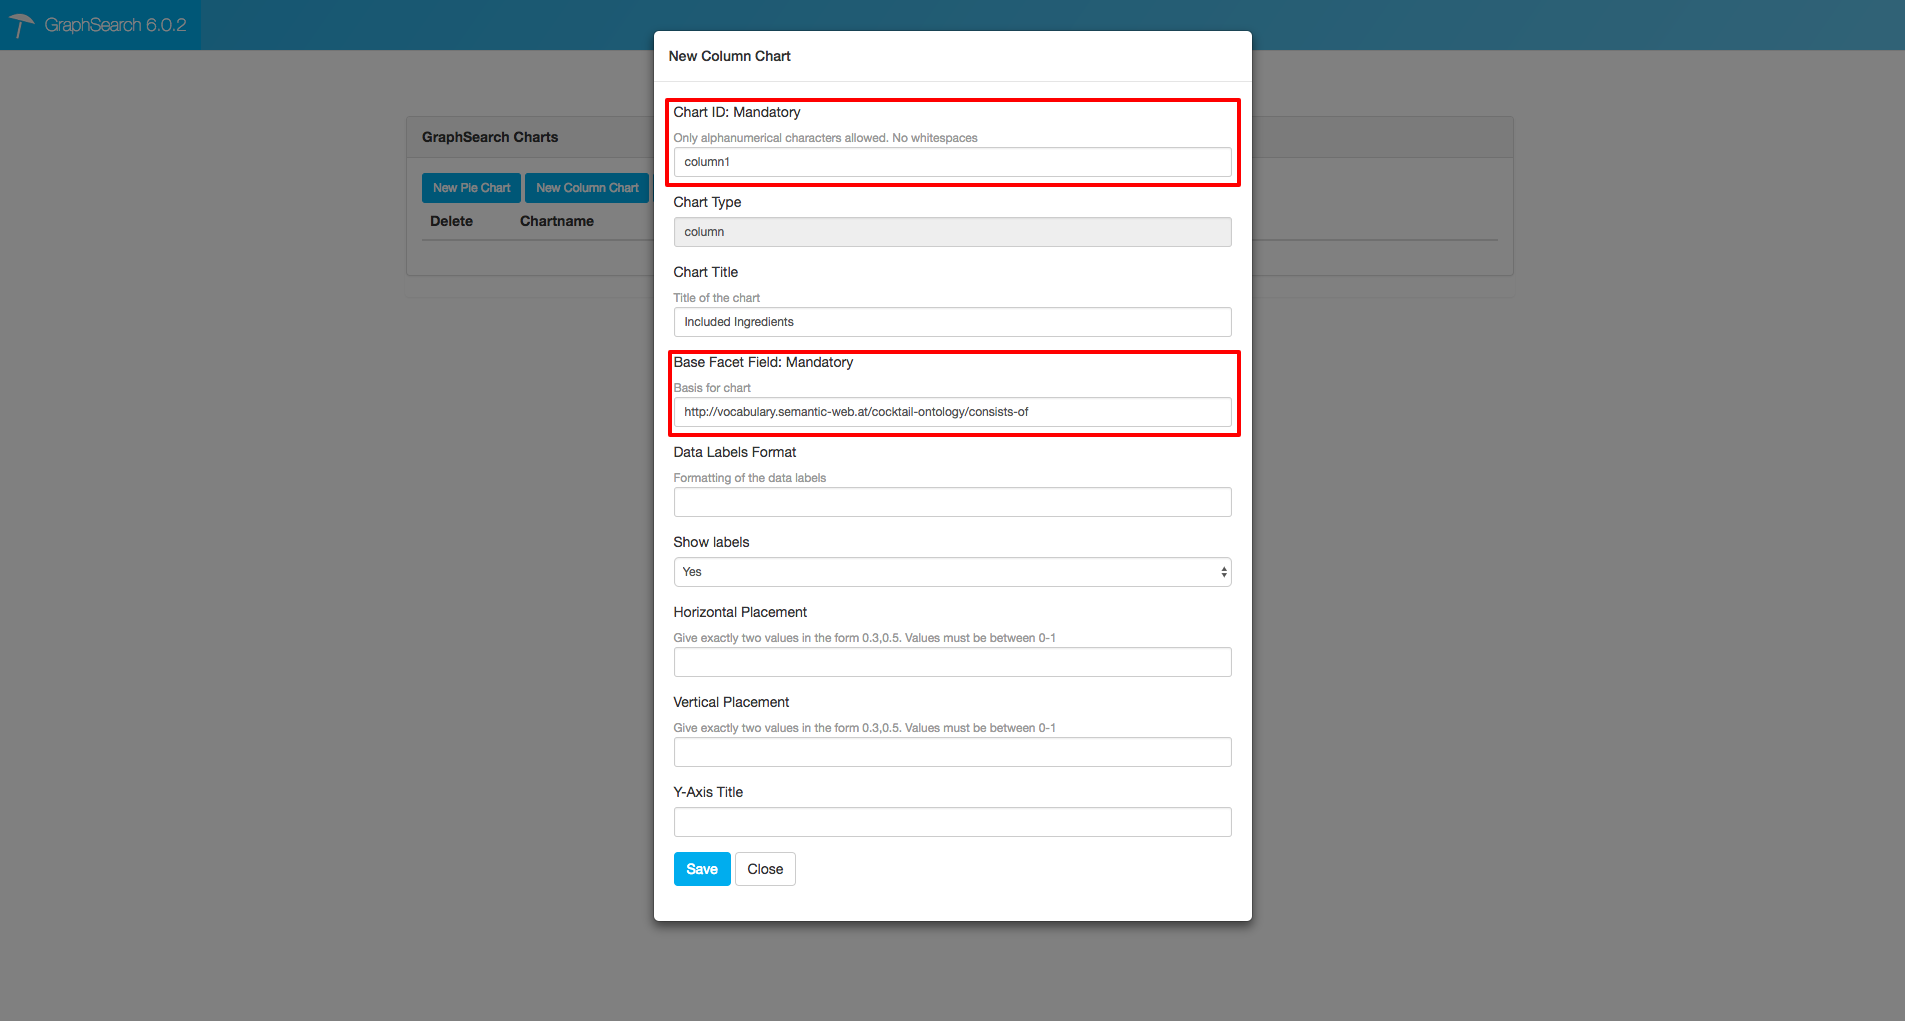
Click the button New Column Chart in the Chart tab to create a new column chart.
Then fill in the required properties in the pop-up configuration dialog.
Again, you have to specify a random chart id and facet to visualize by providing the facet identifier (for Solr / Elasticsearch backend) or facet predicate URI (for RDF database backend).
Note
Compared to pie charts, column charts have one additional optional property 'Y-Axis-Title' where a custom label can be displayed at the left side of Y axis.
See the screenshot below as an example.
 |
 |
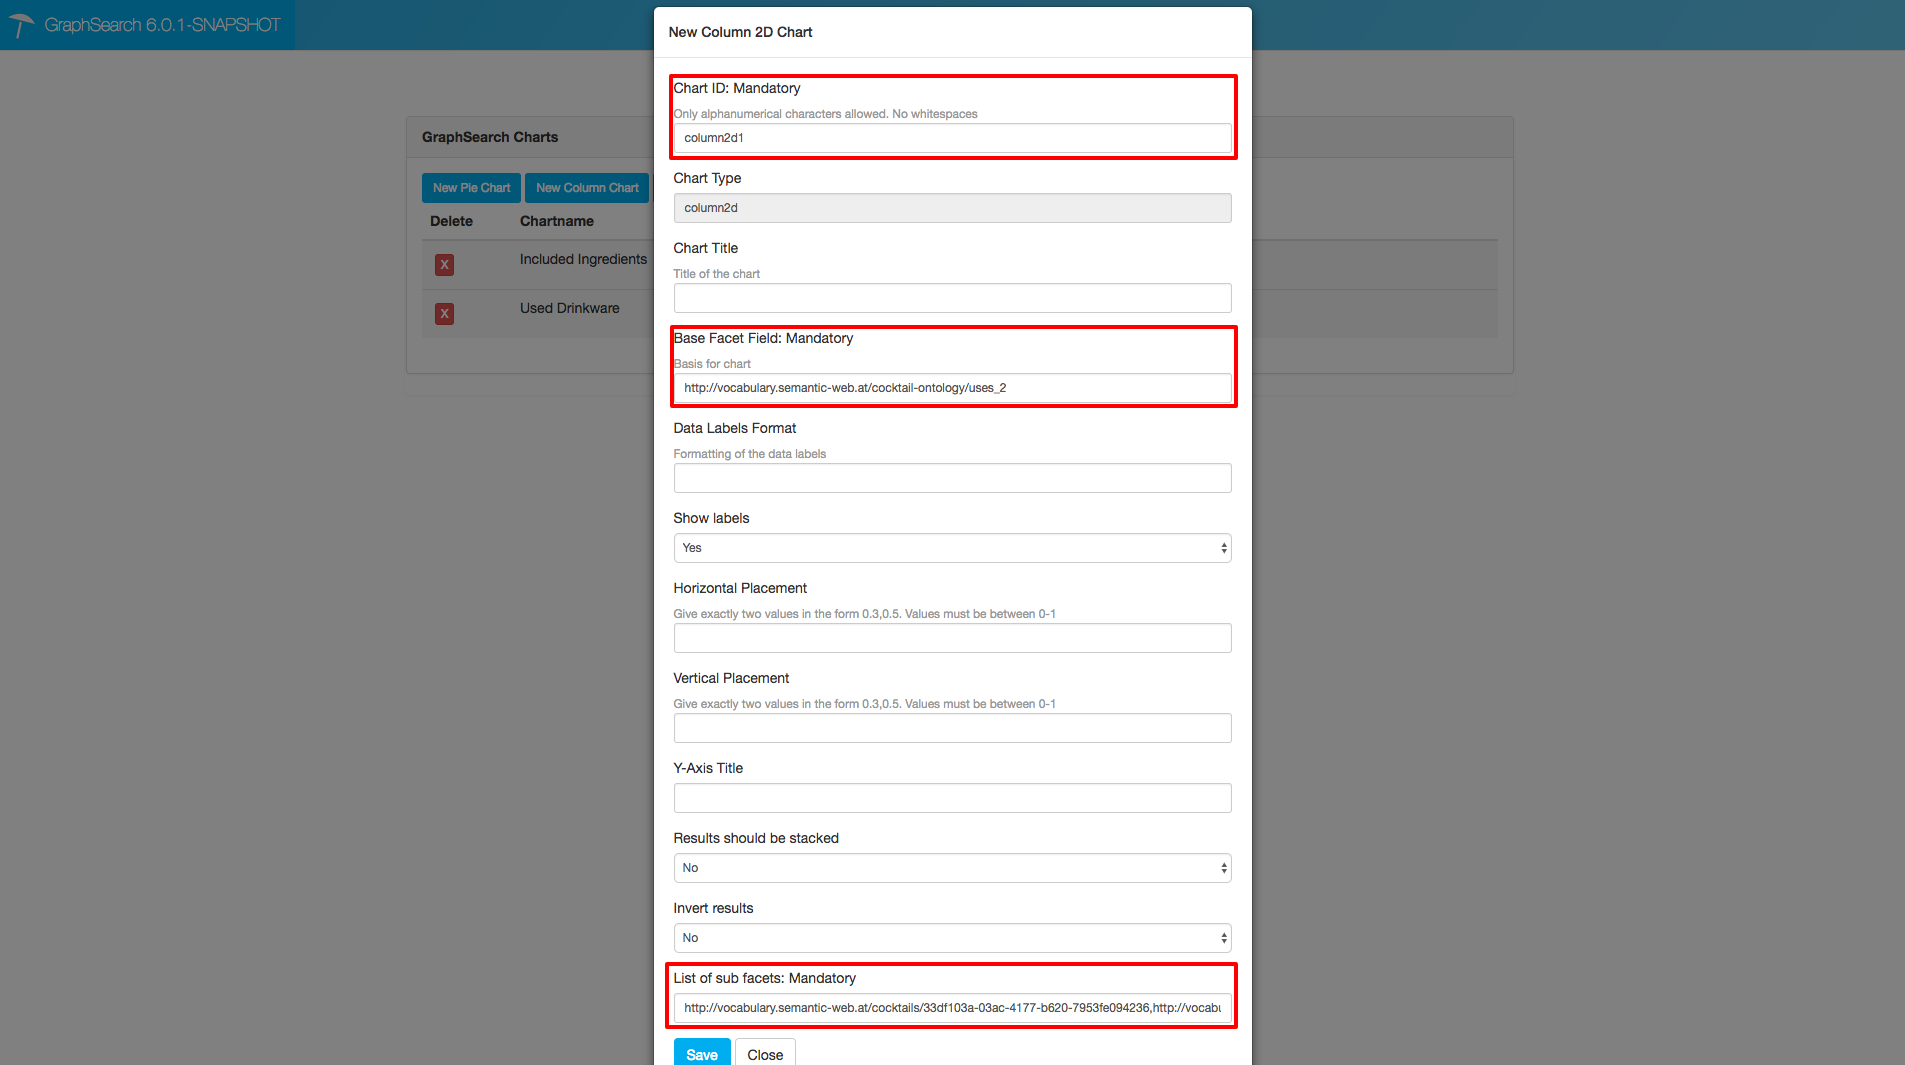
2D Column Chart
The advantage of a 2D column chart is that the chart is faceted into two dimensions.
In addition to the the base facet, one has to specify a list of facet member identifiers (for Solr / Elasticsearch backend) or facet member URIs (for RDF database backend) as sub facet to further expound the column chart.
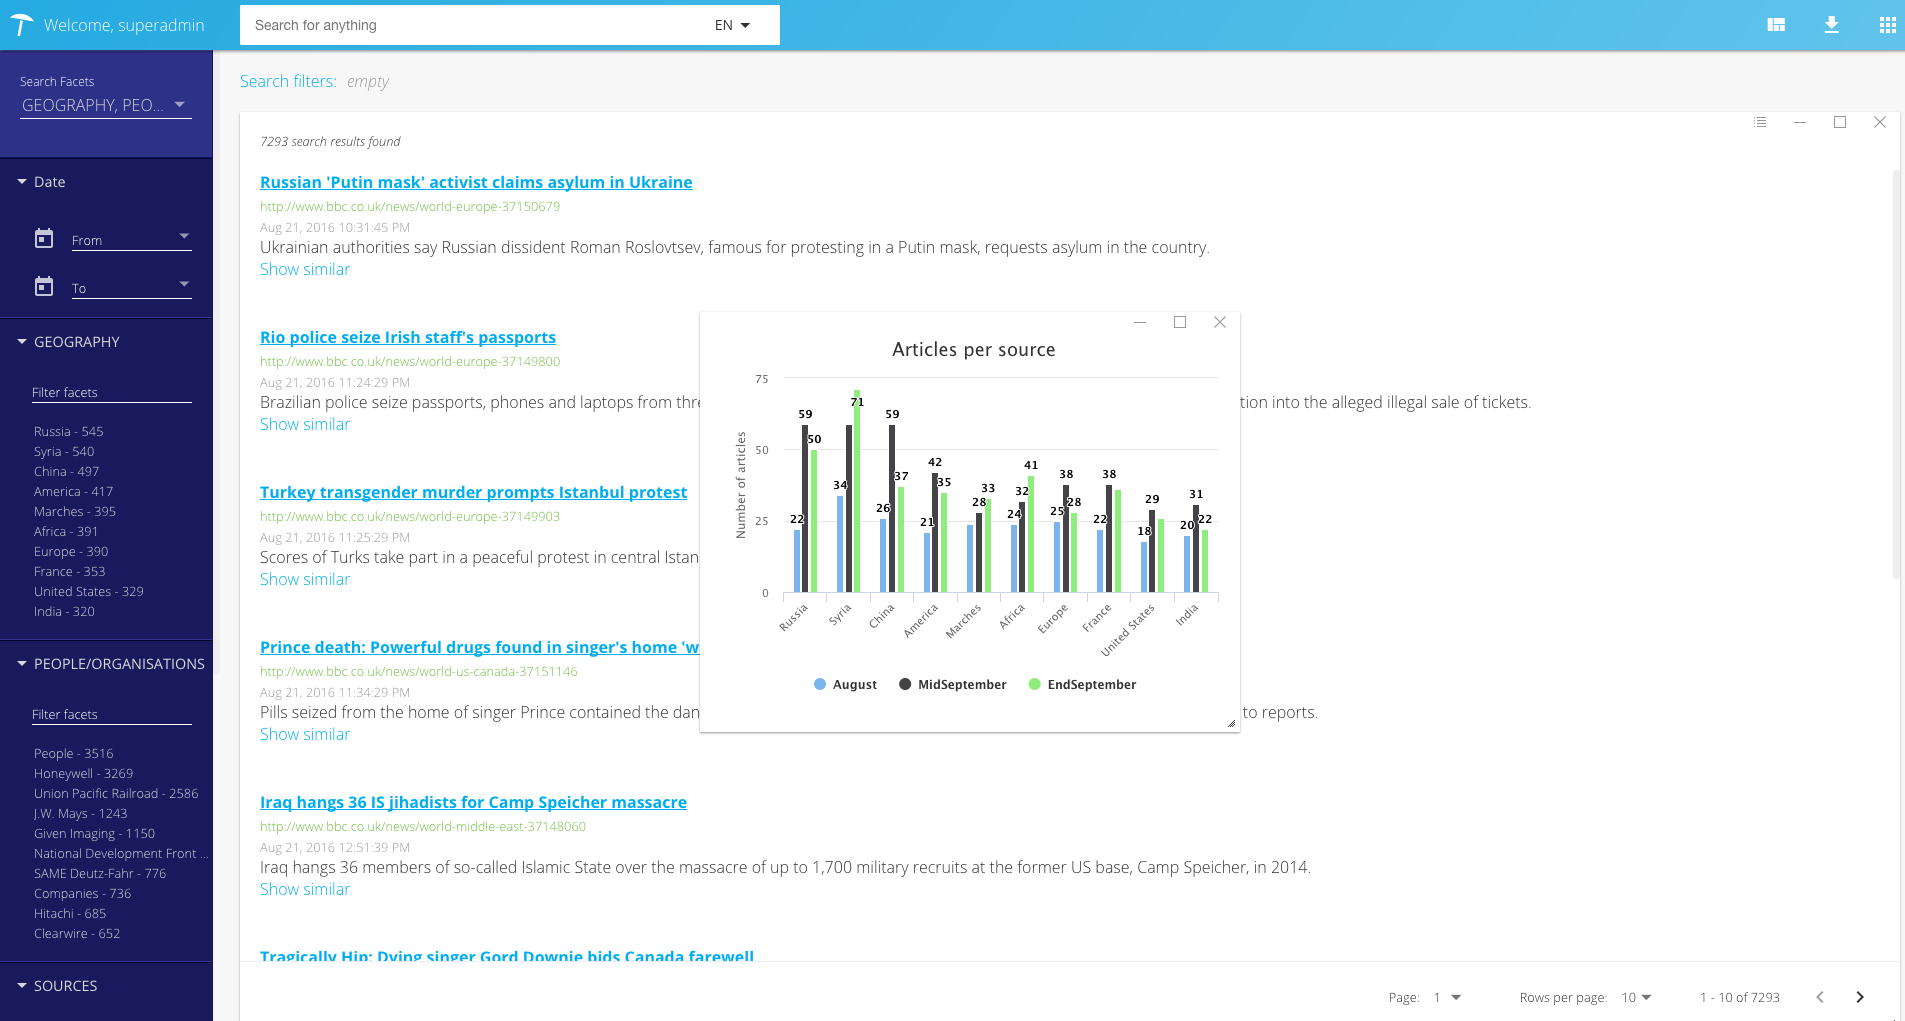
In the example provided below, three facet member URIs are selected as sub facet and the corresponding outcome is illustrated:
 |
 |
Additionally, 2D column chart supports two extra properties 'Results should be stacked' and 'Invert results' where the former will result in a stacked bar chart, and the latter will swap the data used for X axis and Y axis.
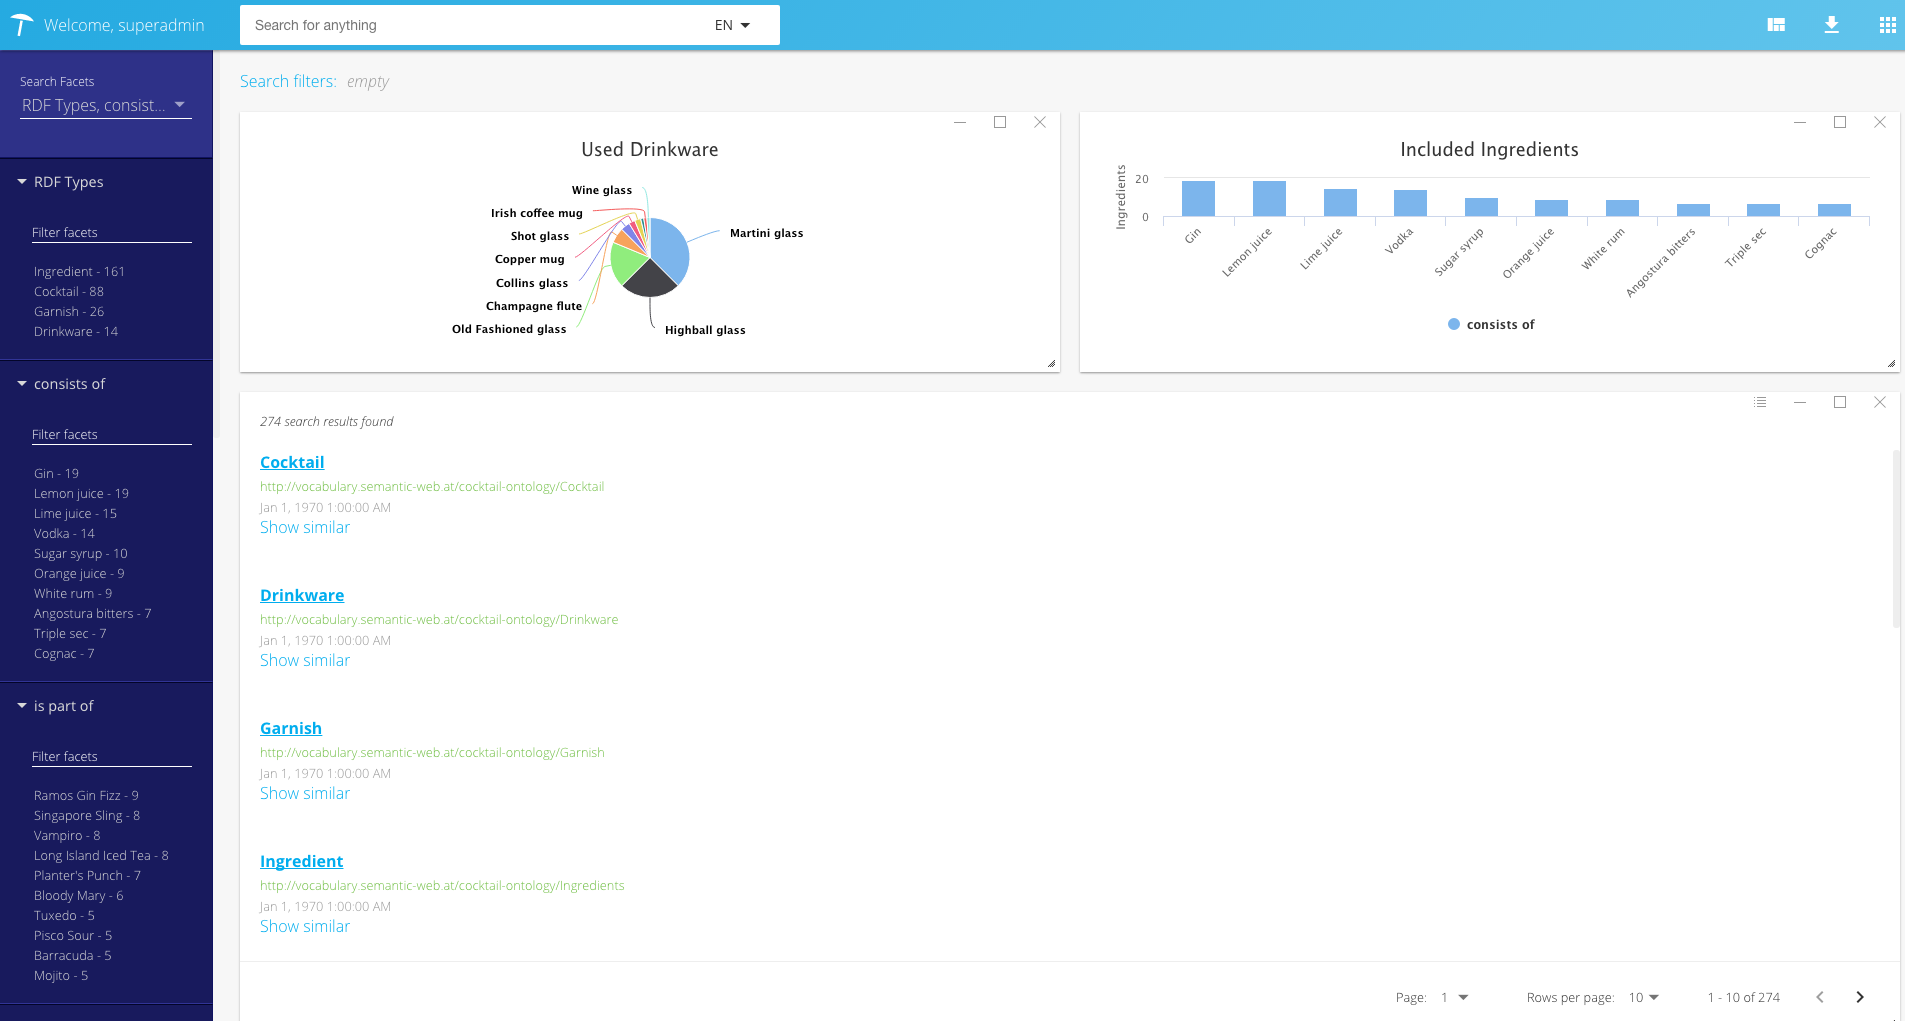
Chart Position
By default, the chart is placed at the center of the search result, if chart position is not configured explicitly.
Therefore, if you configured multiple charts without specifying a position, they will be all stacked at the center.
It is possible to drag and drop the chart to any place by dragging the blank chart window header region, as shown in the following screenshot:
 |
However, such placements are client side and temporary. The default position will be restored after refreshing the page.
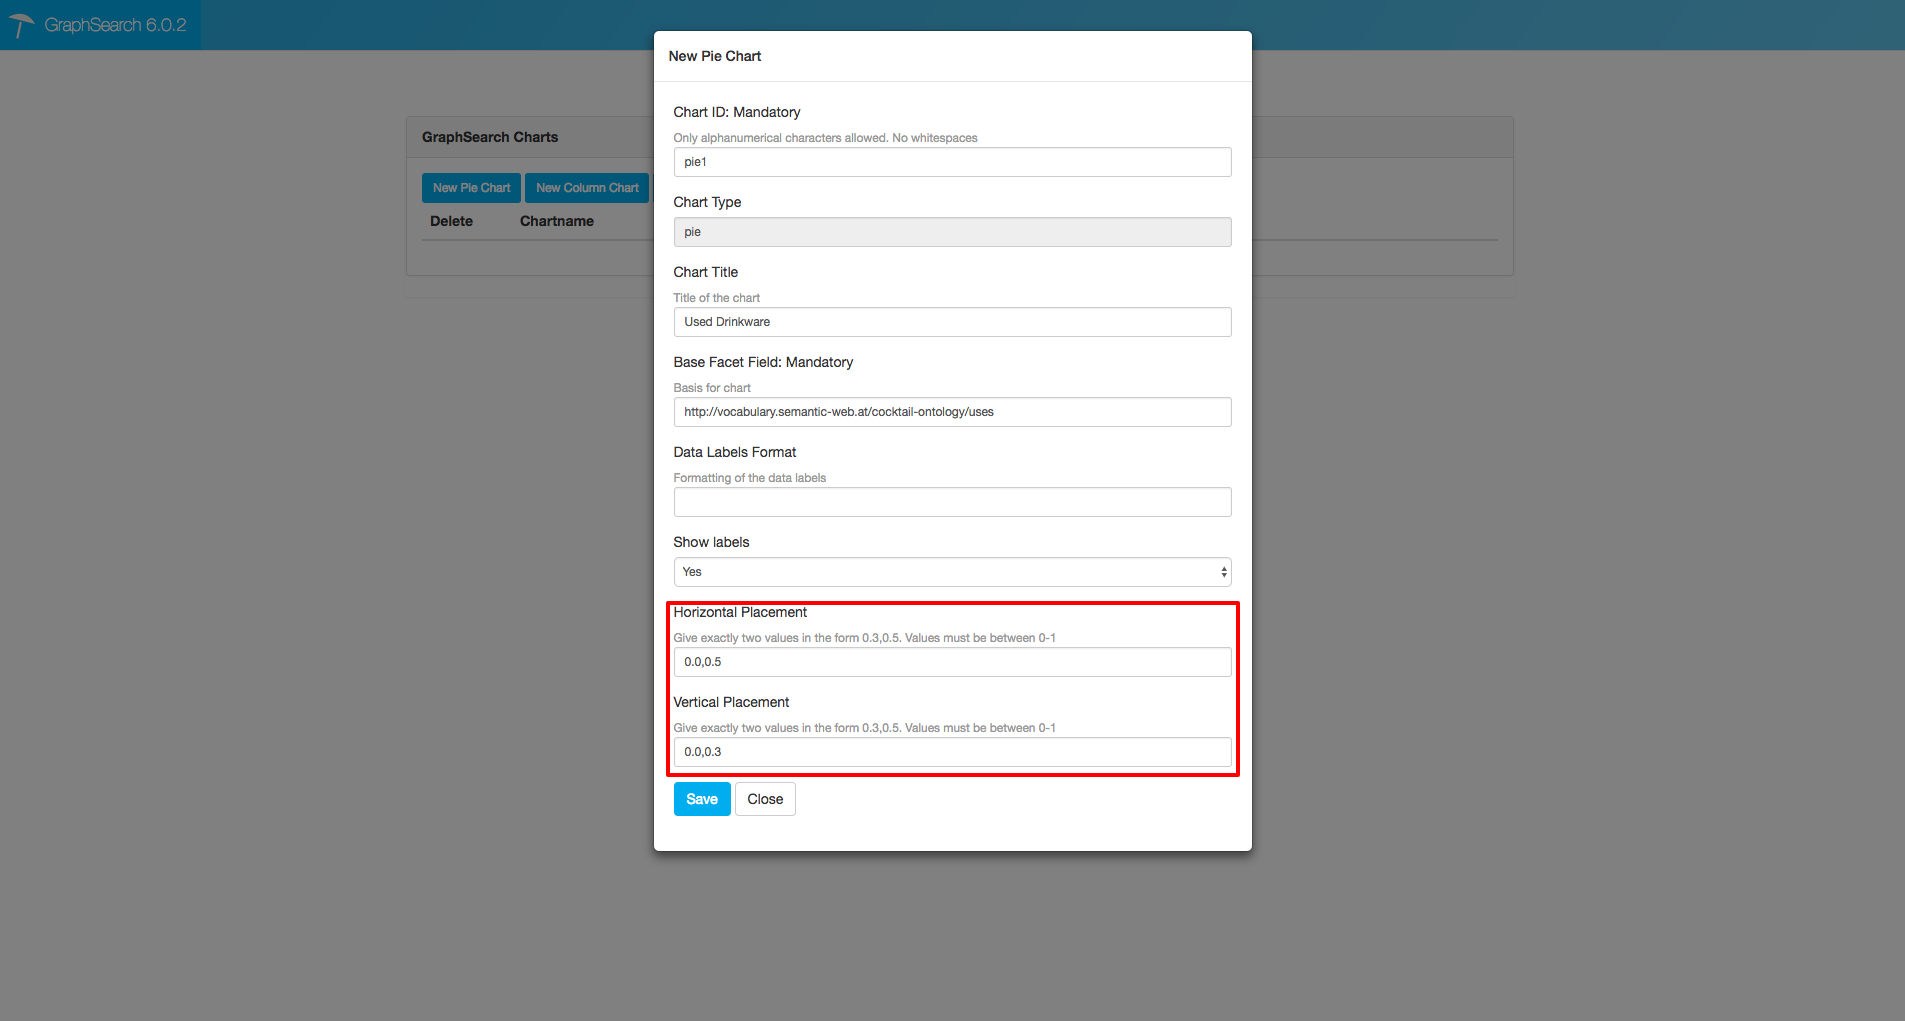
To fix the position of charts at the server side, you have to specify 'horizontal placement' and 'vertical placement' when creating a chart.
Example
By setting horizontal placement to 0.0,0.5 and vertical placement to 0.0,0.3, the chart will occupy half of the horizontal space and 30% of vertical space in the search result window.
The origin of such measurement is upper left vertex of the search result window. Therefore, the chart will be placed at the upper left corner.
See the screenshot for illustration:
 |
 |
Following such logic, you can organize multiple charts in a neat way.
 |